import time
import scipy
import numpy as np
import mymesh
from mymesh import image, contour
import pyvista as pv
import matplotlib.pyplot as plt
img = mymesh.demo_image(scalefactor=0.25)
threshold = 100
h = (0.337891, 0.337891, 0.5)
tic = time.time()
Smcimage = image.SurfaceMesh(img, h, threshold, method='mc')
mcimage_time = time.time()-tic
tic = time.time()
Smc = image.SurfaceMesh(img, h, threshold, method='original')
mc_time = time.time()-tic
tic = time.time()
Smc33 = image.SurfaceMesh(img, h, threshold, method='mc33')
mc33_time = time.time()-tic
tic = time.time()
Smtimage = image.SurfaceMesh(img, h, threshold, method='mt')
mtimage_time = time.time()-tic
tic = time.time()
vox = image.VoxelMesh(img, h, threshold)
vox_time = time.time()-tic
grid = pv.ImageData(
dimensions=img.shape,
spacing=h,
origin=(0,0,0),
)
tic = time.time()
Spvmc = grid.contour([threshold], img.flatten(order='F'), method='marching_cubes')
pvmc_time = time.time()-tic
tic = time.time()
Spvmc = grid.contour([threshold], img.flatten(order='F'), method='flying_edges')
pvfe_time = time.time()-tic
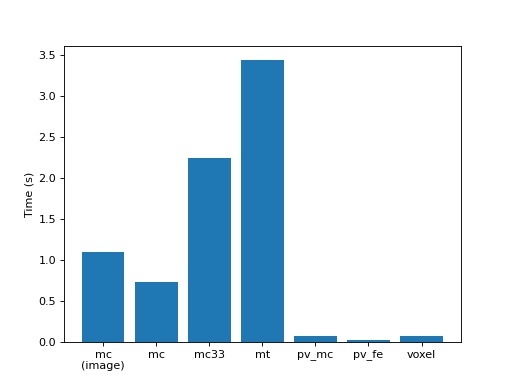
plt.bar(['mc\n(image)', 'mc', 'mc33', 'mt', 'pv_mc', 'pv_fe', 'voxel'], [mcimage_time, mc_time, mc33_time, mtimage_time, pvmc_time, pvfe_time, vox_time])
plt.ylabel('Time (s)')