mymesh.improvement.LocalLaplacianSmoothing#
- mymesh.improvement.LocalLaplacianSmoothing(M, options={})[source]#
Performs iterative Laplacian smoothing, repositioning each node to the center of its adjacent nodes.
- Parameters:
M (mymesh.mesh) – Mesh object to smooth
options (dict) –
Smoothing options. Available options are:
- methodstr
’simultaneous’ or ‘sequential’. Specifies if smoothing is performed on all nodes at the same time, or one after another. Simultaneous laplacian smoothing will move nodes to the center of their neighbors’ initial positions, while sequential will use the current positions of previously smoothed nodes, by default ‘simultaneous’.
- iterateint or str
Fixed number of iterations to perform, or ‘converge’ to iterate until convergence, by default ‘converge’.
- tolerancefloat
Convergence tolerance. For local Laplacian smoothing, iteration will terminate if the largest movement of a node is less than the specified tolerance, by default 1e-6.
- maxIterint
Maximum number of iterations when iterate=’converge’, By default 10.
- FixedNodesset or array_like
Set of nodes that are held fixed during iteration, by default none are fixed.
- FixFeaturesbool
If true, feature nodes on edges or corners (identified by
DetectFeatures()) will be held in place, by default False.- FixSurfbool
If true, all nodes on the surface will be held in place and only interior nodes will be smoothed, by default False.
- limitfloat
Maximum distance nodes are allowed to move, by default None
- constraintnp.ndarray
Constraint array (shape = (m,3)). The first column indicates nodes that will be constrained, the second column indicates the axis the constraint will be applied in, and the third column indicates the displacement of the given node along the given axis (e.g. 0 for no motion in a particular axis))
- Returns:
Mnew – Mesh object with the new node locations.
- Return type:
Examples
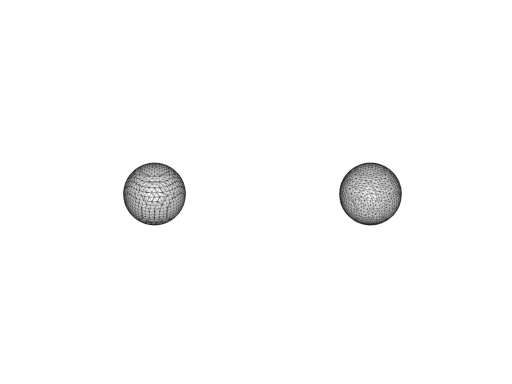
M = implicit.SurfaceMesh(implicit.sphere([0,0,0], 1), [-1,1,-1,1,-1,1],  .1)
Mnew = improvement.LocalLaplacianSmoothing(M, options=dict(iterate=1))

visualize.Subplot([M, Mnew], (1,2), bgcolor='w', show_edges=True)